
The graph below describes what we call the normal distribution. When we measure systems that are intended to perform within certain tolerances, there is variability around the target measurement. Systems that need to perform to specifications try to establish controls that produce results as near the goal as possible and control outliers to the maximum extent.
What is more, most organic measurements you could think of will follow a similar shape. If you took all of the apples on your orchard and weighed them, the distribution of weights would look very much like this curve. Human intelligence, height, weight, the length of a given bone. This is why they call it a normal distribution. Things just naturally concentrate around the average.
If systems are bounded on one side but not the other, you can get a different type of curve. The graph below describes the thickness of zinc plating.
Other models that don’t follow normal distribution are things that involve human activity (as opposed to human characteristics). They also may be influenced by random events. These would include statistics like The number of days between the date an invoice is sent and the payment date.
In case you were wondering, According to the US Census Bureau, the distribution of incomes in the United States is concentrated at the low end of the scale. In the chart below, the last segment on the right is a single entry for all households with over $200,000 in income. In actuality, that segment is something of a throwaway because it would taper down to smaller and smaller numbers along a fairly smooth curve up to millions of dollars in income. The shape of this graph resembles the thickness of zinc plating more so than the average weight of an apple.
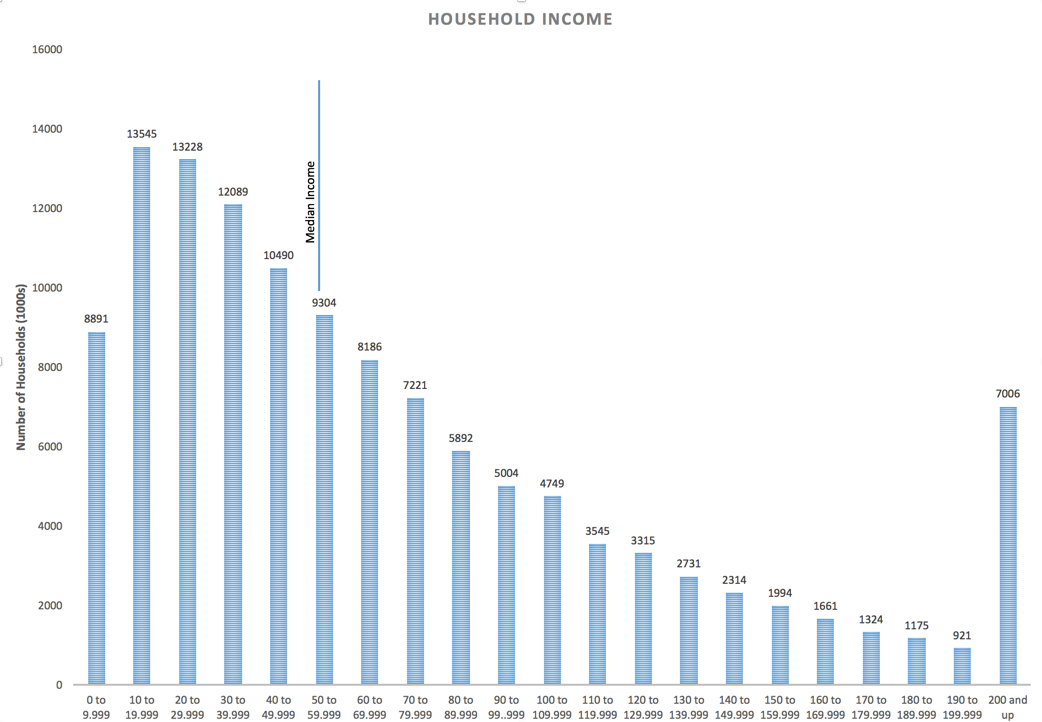
Obviously, half of all households earn less than the median, which is about $53,000 per year and the other half earn above that amount. One problem that jumps out from the chart above is that incomes are clustered at the $10,000 – $20,000 range. With the poverty line hovering at around $16,000 per year for a family size of two, that creates economic pressure.
The tendency for incomes to cluster near the poverty line as opposed to being around the median income seems likely to create risks in terms of the management of resources in times of scarcity. The burden on the half above the median grows as incomes skew downward.
Do we take for granted that it is so much harder to increase your income from $15,000 per year to $20,000 per year than it is to increase it from $185,000 to $190,000? Even if we accept that as a fact, it doesn’t mean we shouldn’t look for ways to lower barriers for breaking out of those lower incomes. Does the economy, as a mechanism, have any role in flattening the curve or creating better conditions for pushing incomes upward?
The shape of this graph has been changing for some time and its tendency for incomes to cluster around the poverty line is getting stronger and not weaker. Depending on the company you keep, this trend is the result of either too much or too little government influence. Either the government is trying to do too much and thus creating a dependency mind-set, or it is doing too little by not ensuring that low income and families without skills or education can create opportunities for themselves and their children.
People can readily produce anecdotal evidence for either case. Tax cuts are seen by some as a positive move where the government steps back and lets private industry spend its windfall, hopefully on new business opportunities and new jobs. These, unfortunately, haven’t produced many jobs in the middle class or much growth in incomes so far. Tremendous growth in personal wealth at the top of the economic ladder has not translated into prosperity for increasing numbers of people at the bottom of the economy.
Meanwhile incidents of fraud, waste, and otherwise gaming the system are not fictitious. Addiction, abuse, health problems and even natural disasters will create other, difficult to manage challenges as well. Having said that, it’s also clear that food stamps, Medicaid and other programs can create relief. This is especially true for children who have not failed anyone, and for whom we want to make room on the road to a good life, a good job and opportunities for their own children.
A decline in opportunities for good paying, non-skilled labor has had an impact. Globalization creates both opportunities and hardships. Some skilled labor is now giving ground to increased automation. This creates real economic tension. There are immediate problems for those who would have otherwise worked in factories or mills and there are longer term problems on the horizon for increasing numbers of people.
If it is a goal to move the household income clusters to the right and bring more people out of poverty. We have to examine the barriers to upward mobility and identify ways that we can take them away. There aren’t simple answers, but it isn’t unreasonable to examine specific reasons why our economic system is not creating as many successful citizens as it once did. This should be of some concern to all of us.
Bearing in mind the fact that the national and global economy is not the same as it was in 1960, or 2007 even, we should be looking for as many ways to create prosperity for the people who need the most help.